

Abstract
BACKGROUND
Graft versus host disease (GvHD) is a major complication of allogeneic hematopoietic cell transplantation (HCT) mediated by donor immune cells reacting against host tissues. GvHD diagnosis is often challenging and superior non-invasive imaging strategies specifically detecting early GvHD are critically needed to improve clinical care of HCT recipients. Positron emission tomography (PET) imaging for GvHD diagnosis employing conventional tracers (18F-FDG) have largely been confounding, mainly due to their low specificity. Monitoring T cell activation and expansion using T-cell targeted PET tracers seems a more promising approach (Ronald et al., Cancer Res 77(11) 2893, 2017). We recently reported a novel immuno-PET tracer (64Cu-DOTA-mAbOX40) that enables non-invasive imaging of activated murine T cells expressing the cell surface activation marker OX40 (Alam et al., JCI 128(6) 2569, 2018). In the present work, we evaluated the utility of this immuno-PET strategy to image activated T cells in a major MHC-mismatch mouse model of acute GvHD.
METHODS
Balb/C (H-2Kd) recipients were irradiated with 8.8 Gy and on the same day received intravenously (i.v.) 5 x 10e6 T-cell depleted bone marrow (BM) cells with or without 1 x 10e6 CD4 and CD8 T cells positively selected from C57BL/6 (H-2Kb) mice. Severity of GvHD was assessed by clinical GvHD scoring. Flow cytometry of lymphoid organs from BM control and GvHD mice was performed at day 7 after HCT to determine OX40 protein expression on immune cells. For imaging studies, anti-OX40 monoclonal antibody (mAb) specific for murine OX40 (clone: OX86, BioXcell) was conjugated to DOTA chelate. The conjugate was evaluated by mass spectrometry (an average ratio of 1.4 DOTAs per mAb was obtained) and subsequently radiolabeled with 64CuCl2 (final specific activity 10-15μCi/μg and radiochemical purity >99%). Mice were tail-vein injected with 64Cu-DOTA-mAbOX40 (100 µCi, i.v.) at day 7 after HCT and PET-CT imaging performed 24 hours after injection. Immediately following PET-CT mice were euthanized and radioactivity measured in dissected weighed tissues using a gamma-counter.
RESULTS
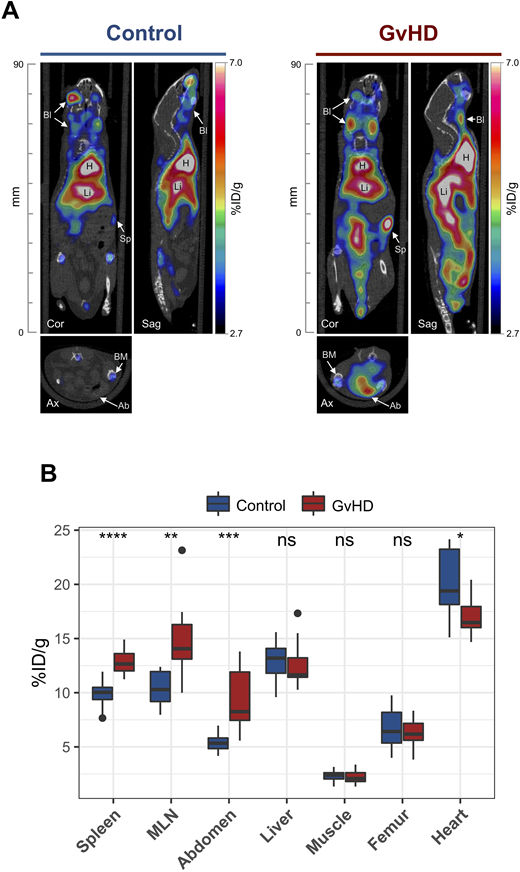
Flow cytometry analysis of OX40 expression in lymphoid organs isolated at day 7 after HCT revealed significantly higher proportions and absolute numbers of OX40 expressing cells in the spleen and cervical lymph nodes (LN) isolated from mice that received BM + T cells (GvHD group) compared with mice having received BM cells alone (p<0.05). In vivo OX40-ImmunoPET performed at day 8 after HCT revealed increased radiotracer uptake in spleen (p < 0.0001), mesenteric LN (p < 0.01) and the abdominal region (p < 0.001) of mice with GvHD compared with BM control mice (Fig. 1A and B). Interestingly, 64Cu-DOTA-mAbOX40 uptake in spleen, mesenteric LN and abdominal region positively correlated with the GvHD score [spleen, r=0.6, p=0.0018; mesenteric LN, r=0.42, p=0.042; abdomen, r=0.77, p < 0.0001]. Biodistribution analysis using gamma counting of tissues confirmed the PET results showing the same trends; significantly increased uptake in GvHD mice compared with BM controls in spleen (p < 0.01), cervical LN (p < 0.01), mesenteric LN (p < 0.01) and GvHD target organs e.g. small intestine (p < 0.05), colon (p < 0.05) and skin (p < 0.01). Importantly, outcome analysis of GvHD mice receiving tracer doses of OX40 mAb at day 7 after HCT did not reveal any significant worsening of GvHD in terms of survival, body weight loss or GvHD score, compared with mice receiving the appropriate isotype control, supporting the safety of this OX40-targeted imaging approach.
CONCLUSION
The OX40 immuno-PET tracer enabled specific imaging of alloreactive OX40+ activated T cells in a murine model of acute GvHD. Efforts are ongoing to develop a humanized version of the 64Cu-DOTA-mAbOX40 tracer that will provide a readily translatable tool for GvHD diagnosis in the clinical setting.
FIGURE 1. 64Cu-DOTA-AbOX40 PET-CT imaging in a mouse model of acute GvHD. (A) Representative day 8 64Cu-DOTA-AbOX40 PET-CT images in BM controls or GvHD group. H, heart (including cardiac muscle and blood); Li, liver; Sp, spleen; Bl, blood vessels and venous sinuses; BM, bone marrow; Ab, abdomen. (B) Quantitative region of interest PET image analysis of indicated organs in BM controls (n=12, blue filled boxes) or GvHD mice (n=12, red filled boxes). Outliers are represented as dots. [Mann-Whitney test , ****p < 0.0001, ***p < 0.001, **p < 0.01, *p < 0.05].
Gambhir:CellSight Inc: Equity Ownership, Membership on an entity's Board of Directors or advisory committees.

This feature is available to Subscribers Only
Sign In or Create an Account Close Modal